Attribute-value chain technique concerns the relationship between enterprise and milieu. This method gives a tool for external mapping phase of the creative process. This technique has been derived from means-end chain (Reynolds, Gutman, 1988), uses the graphic features of simplicity and effectiveness of mental maps within a new methodology that, through a direct questionnaire survey and the use of an appropriate «statistics» (the canonical correlation analysis), produces as an output a mental map which is able both to act as a check instrument (feedback), and to stimulate the next phase of idea generation in the above-described company’s creative process.
Introduction to the methodology
Products and services can be characterized by a set
of attributes. Each brand or product is considered to have a certain
level of performance on each of these attributes. The consumer ascribes
an overall value to a specific product based on how the product is perceived
to perform on the various attributes and based on how important these
attributes are. Beside this point of view, in order to position products
and brands at a higher level, we need to understand and measure the
meanings that products have for consumers. A theory that provides such
an understanding is the attribute-value chain theory. This theory establishes
a link between the attributes of a product and the individual and social
needs of consumers, that are personal values. In fact, this theory is
based on the assumption that “product or service is a mean that
customers use to reach an end (that is, to satisfy one or more of his/her
personal values)” (De Heer and Van Houten, 2001). Therefore products
and personality can be correlated. In so doing, we suppose that goods
could be described by their attributes and, at the same time, that consumers
make a choice according to some personal values that they want to satisfy
by using the product. It is clear how important is the right comprehension
of the link between attributes and values, especially for the product
development.
In this sense, things that people buy have also personal and social
meaning. Modern goods are recognized as psychological objects that symbolize
ends and aims. Therefore products are bought for what they do for consumers.
Elements of the analysis
According to its name, the attribute-value chain analysis looks at two fundamental aspects of external environment: attributes and values.
Attributes
They are inside every product or service and are defined
as the physical features by which the product could be described. It
is fundamental to define which attributes of a specific product are
important and how they refers to consumer’s personal values.
Attributes are distinguished in two main classes, depending on their
level of abstraction. These classes are:
Attributes gain their relevance because they allow the consumer to achieve certain advisable values such as, for example, happiness, security or sense-of-belonging.
- Concrete attributes, which are the physical, tangible features of a product, such as, for example, colour, shape, weight etc.
- Abstract attributes refers to intangible, subjective features of a product, which can’t be directly measured by senses, such as comfort, design, line etc.
Values
They are mental representations of important personal
objectives or needs that customers want to satisfy by using or purchasing
the product. Values satisfaction is a very personal and intangible experience
that involve symbolic meanings. In so doing it is associated to high
emotional reactions. For example, emotional system produces good feelings
if one or more advisable values, such as “self esteem”,
are achieved. On the contrary, negative emotional response as “angry”
appears when the subject can’t satisfy some of his/her personal
values. In other terms, values satisfaction provides good feelings and
vice-versa. In accordance with this consideration, the meaning of a
product can be different depending on the values aimed by consumers.
Aim of the analysis
The aim of the attribute-value chain is to analyze in depth the relationships between variables that describe enterprise products (attributes) and variables that describe consumers (personal values), understanding:
-
how a specific enterprise is considered by its consumer target;
-
which attributes of the product are more important for consumers, that is, which features they perceive better;
which are the relations between attributes and personal values, that is, which consumer’s personal values are more affected by a specific feature of the product.
Methodological steps
The attribute-value technique needs several methodological steps, some of which involve directly consumers. It is possible to recognize four main phases, that are respectively:
1. Definition of the survey
The first step aims to point out the most important
product attributes and the most important personal values for consumers.
This phase could be highly time-consuming. For this reason it is better
to realize a statistical survey on a pre-established sample of consumers,
by using a semi-structured questionnaire
The questionnaire is organized in four sections. In the first one you
have to collect personal data about consumer, in order to define an
homogeneous statistical sample. In fact, personal values depend on elements
such as age, sex or job. The second part of the questionnaire concerns
product attributes. Depending on the complexity, product attributes
can be many and many more. For this reason you have to split them in
some macro-categories. The consumer interviewed chooses one of this
categories, obviously the one he/she considers more important with regard
to the specific product he is judging. In the following section of the
questionnaire, that is the third one, the consumer is asked to evaluate
only the attributes that belong to the macro-category previously selected.
In so doing, consumers avoid from evaluating features that they don’t
consider important. Moreover each one of the attributes is clearly described
to avoid any possible misunderstanding.
These attributes are chosen directly by the researcher. This solution
obviously limits consumers’ freedom of action but it is the only
practicable way using a questionnaire tool. Reasonably, data could be
also collected by using direct interviews (in which all variables, attributes
and values, emerge from the discussion). Actually, this approach is
more time-consuming because it needs the researcher to conduct directly
every interview. As we will see in the following steps of the methodology,
collected data have to be statistically analyzed. This means that the
dimension of the statistical sample must be considerable in order to
produce relevant results. Depending on this consideration, questionnaire
approach involves more consumers rather than direct interviews, under
the same time conditions.
The last section concerns the evaluation of a set of personal values.
Also in this case, values are chosen by researchers and belong to general
aims of human being. Typical examples are “freedom”, “happiness”
or “self-esteem”. Generally, the number of values varies
from 20 to 30. Basically these values must be evaluated independently
from the selected attributes. The correlation between this two kind
of variables indeed will be identified lately by using the statistical
methods.
Both for attributes and values, consumers are asked to give a score to every variable. They answer to questions formulated all in the same way that is, exactly, “how much do you care for …?”. The score ranges from 0 to 5, where “0” means “no interest” while “5” suggest “maximum interest”.
2. Collecting data from questionnaire
The aim of this step is to realize a “collecting
matrix” (Fig.1.1.) where each row represents a consumer
and every column corresponds to a specific attribute or value. Finally,
there will be as columns as the sum of attributes and values in the
questionnaire. In so doing, each collected questionnaire represents
a single-row matrix. It is fundamental to consider each attributes’
category separately, that is, to realize an independent matrix for each
one of them. For example, if there are R attributes from the same category
and S values, then the number of columns of the “collecting matrix”
is R+S.
The collective matrix has inside all the necessary information to draw
the final cognitive map. In fact, crossing a column with a row, it is
possible to identify a score that links the variable in column with
the questionnaire in row.
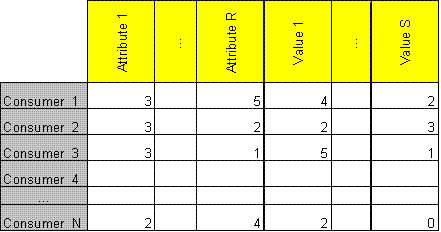
Fig 1.1. Example of a collecting matrix
3. Data statistical analysis
At this point collected data must be statistically analyzed to identify the elements (attributes, values and links between them) to put in the final cognitive map. The information required are the following:
• Relative importance of attributes;The first two information are very simple to achieve. Indeed, you just need to add in column the scores in each cell of the collective matrix. Moreover, the researcher defines two independent lists, one for attributes and one for values where elements are arranged by their relative score.
• Relative importance of values;
• Most significant values;
• Relations between attributes (all) and most significant values.
Now it is better to clarify the difference between the terms “importance” and “significance” of a variable. The first refers to the total score that the sample of consumers give to this element, while “significance” refers to the role of a variable in relation with the other ones, that is calculable by using a specific statistical analysis called canonical correlation analysis.
Canonical correlation provides the relation between two sets of variables when each set is composed by at least two elements. In the attribute-value chain analysis the two sets are composed respectively one by attributes and one by values. The basic idea behind this technique is to eliminate complexity by reducing the number of variables, without losing information which were inside original data sets.
Using this tool it is possible to select the most significant values from the starting list, because we need to reduce the number of values to be put into the map. In fact too much variables limits the effectiveness of the map, especially if this elements are not significant related to the features of the considered product. Moreover you can consider the whole number of attributes because they are few (five or six for each category).
The last information you need to draw up the cognitive map is the power of relations between all the attributes of a category and the selected personal values. First of all you have to construct the “correlation matrix” (Fig.1.2), that is a symmetric matrix where rows and columns represent the whole attributes and personal values. Then you have to select the quadrant with the correlation between the variables, that is the one with attributes on rows and values on columns.
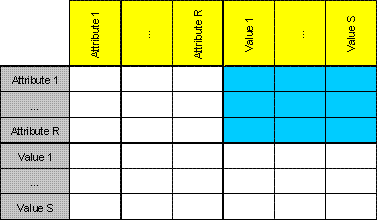
Fig 1.2. Example of correlation matrix
Now, you have to eliminate the columns that correspond to the values not previously selected. The result is the “reduced correlation matrix” (Fig.1.3) . Looking at the score in each cell of this matrix, you can determinate the power of the relation between the attribute and value that cross the cell. These scores are included between 0 and 1, where “0” indicates that the two elements crossing the cell aren’t correlated in any way, while “1” indicates maximum correlation. For example, a score 0,7 means that the correlation between the two variables that cross the cell is 70% of the perfect correlation (perfect correspondence). A good rule may be to consider only the cells that have a score more than 0,3.
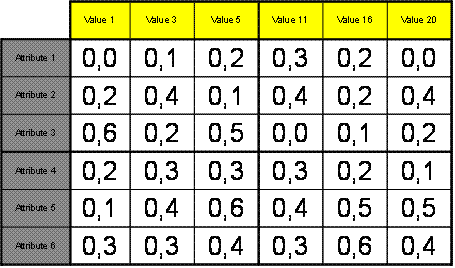
Fig.1.3. Example of a "reduced correlation matrix"
At this point you have all the elements necessary to build the cognitive map.
Building of the final cognitive map
As already said, the practical result of the attribute-chain analysis is a graphical representation, in form of a cognitive map. In the latter you represent all the attributes of the chosen category (the one that consumers select), the values selected by using a criterion of significance, and the relations between them.
Graphical representation of elements on the map
Basically it is necessary to define three features for each element put into the map, that are shape, dimension and colour.
About attributes and values:
Shape and colour: in practical terms, variables are represented as circles. It is easier to distinguish between attributes and values, for example, using different colours.
Dimension: the surface of each variable is proportional
to its relative importance (calculated as seen previously). In other
terms, you have to find the most important attribute and to assign it
an arbitrary surface dimension on the map. The other attributes’
dimensions are calculated proportionally, using their relative scores.
It is important to work individually for attributes and personal values.
About relations
They are represented as arrows with colour and dimension proportional
to their score in the correspondent cell of the “reduced correlation
matrix”. You can use the following schema (Fig.1.4) to choose
the right colour and thickness.
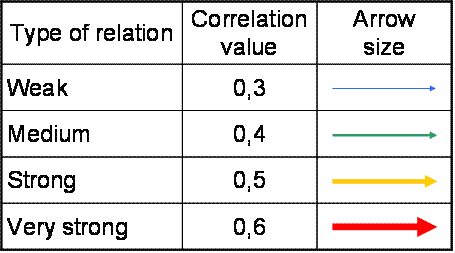
Fig.1.4. How to choose the right arrow
Layout of the map
The variables are put in the sheet by following two simple rules (Fig.1.5):
- Attributes are drawn on the lower part of the sheet, while personal values are put in the higher part. In so doing it is necessary also to consider the “centrality” of each variable. In fact, most important elements (fixed as previously described) must be put in the middle of the sheet.
- Relations starts from an attribute and reach one or more values. Here below is presented an example of general cognitive map, where you can notice the features and the layout of each element such as just described.
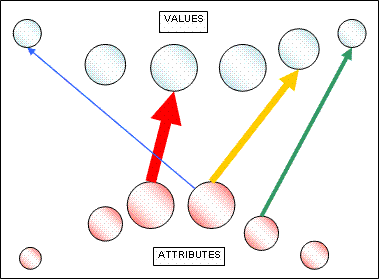
Fig. 1.5 Example of mind map
Moreover, to support the graphic representation, several reading-keys have been identified, following four main lines, that is:
- the analysis of the most important attributes and values;
- the analysis of the most important links;
- the analysis of the most significant levers;
- the analysis of the important but not significant levers.
Each reading-keys could be analyzed using a schema
as the following one (Fig.1.6), where attributes are put on rows and
values are put on columns, as occurred in “reduced correlation
matrix”. These element are ordered basing on their importance.
The number of spots in each cell represents the power of the linkage
between the attribute and the values that cross the cell.
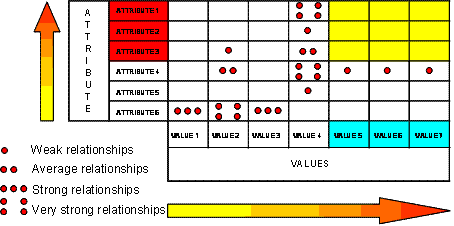
Fig. 1.6. Example of reading-key
Outcomes gained allowed to understand what are the most important product characteristics according to the target of interviewed customers and above all to correlate them directly with the whole set of personal values that themselves want to satisfy by the purchase or use the product.
- Presentation of Attribute-Value Chain (Eng)
- Presentation of Attribute-Value Chain (It)
- Case study Derbi-Piaggio
-
De Heer J., Van Houten Y., Iacob S., Van Vilet H., GigaCE, in https://doc.telin.nl, Telematica Instituut, 2001.
-
Peter J.P., Olson J.C., Consumer behaviour and marketing strategy, 3rd ediction, Richard Irwin, Homewood, 1993.
-
Reynolds T.J., Gutman J., (1988): Laddering Theory, Method, Analysis and Interpretation, Journal of Advertising Research, 28, 1.
-
C.Dehon, P. Filzmoser, C. Croux, Robust Methods for Canonical Correlation Analysis, in http://www.statistik.tuwien.ac.at/public/filz/papers/namur00.pdf
